How Net Generation Has Changed in States with Renewable Portfolio Standards
Credit to Author: Sonal Patel| Date: Wed, 04 Sep 2019 12:48:26 +0000
The post How Net Generation Has Changed in States with Renewable Portfolio Standards appeared first on POWER Magazine.
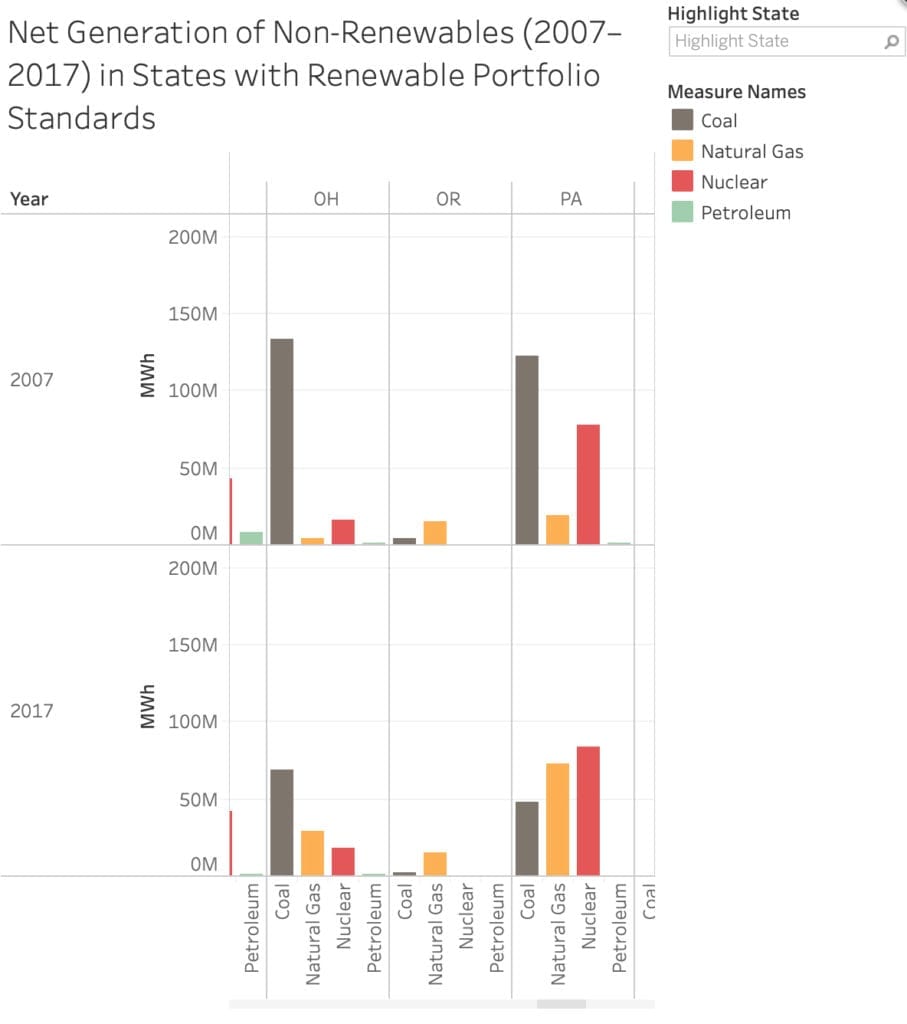
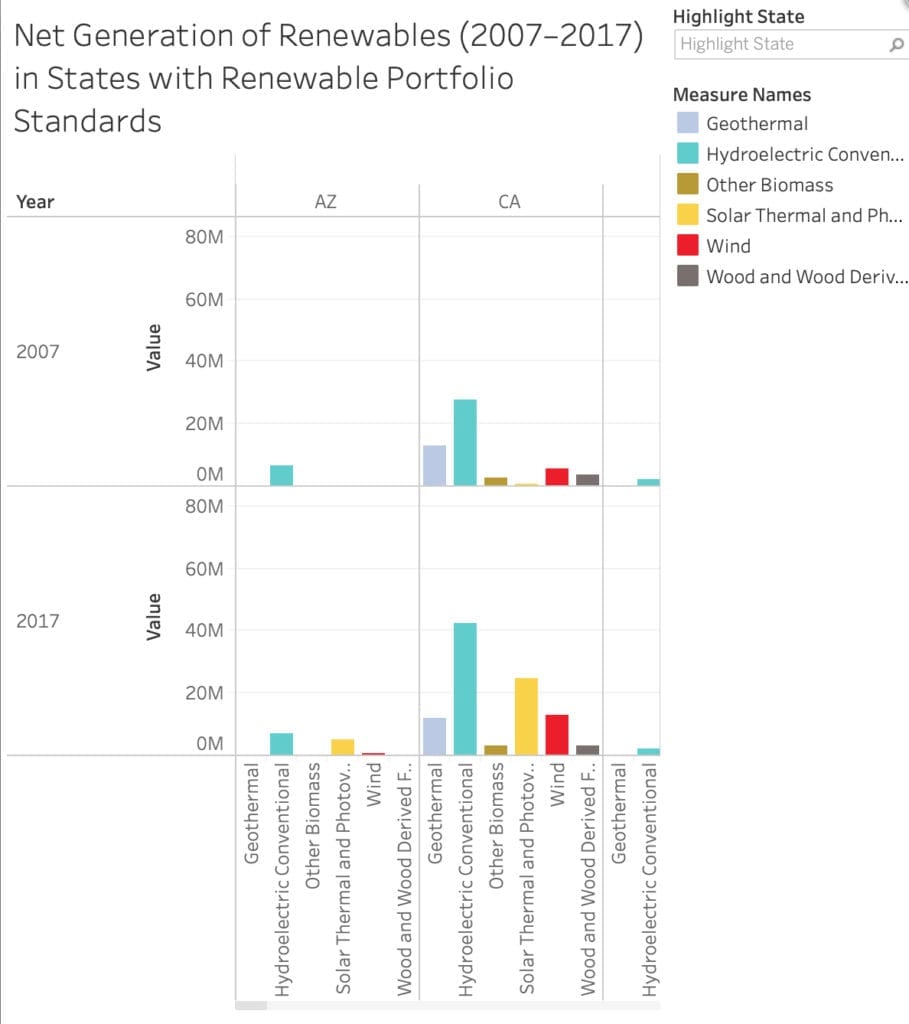
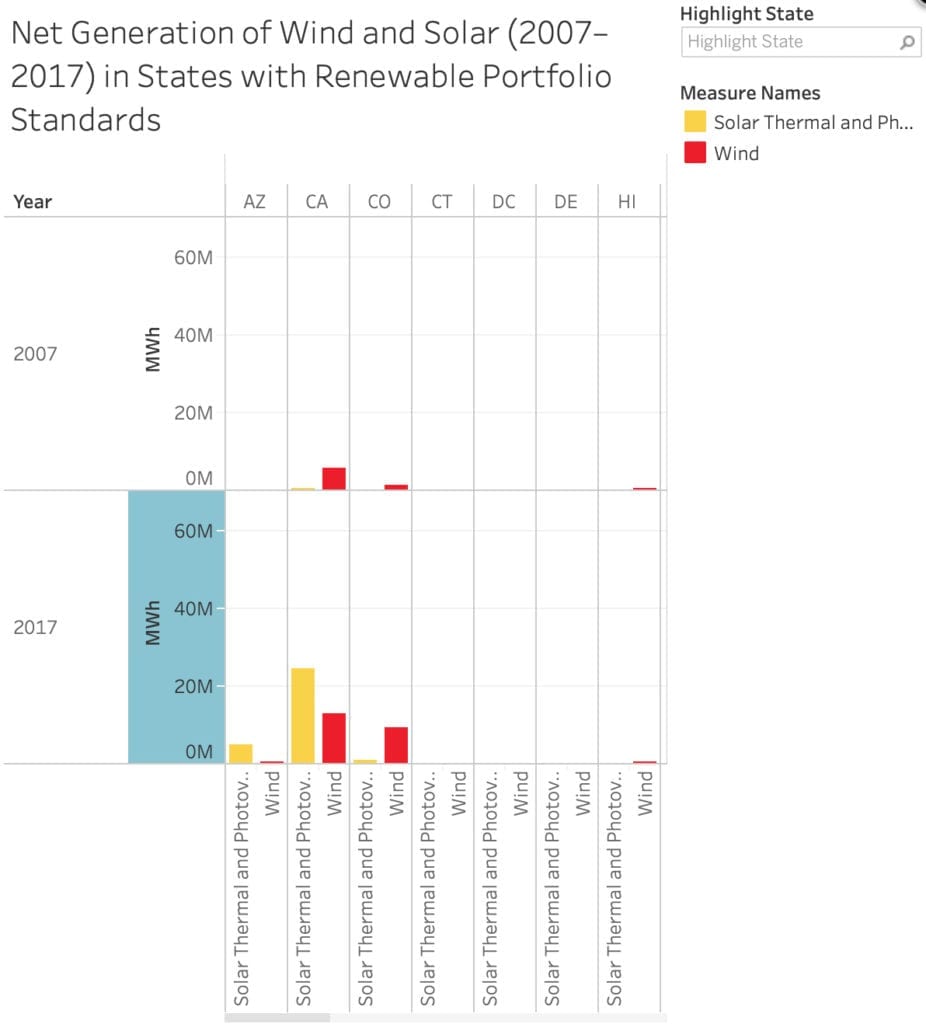
As of August 2019, 29 U.S. states and the District of Columbia had renewable portfolio standards (RPSs), and eight others had non-binding renewable portfolio goals. Three states also had clean energy standards, which set targets for low-carbon non-renewables, like nuclear, and two had clean energy goals. Our monthly infographic in September 2019 shows how shares for each source in states with targets have changed. Here’s an interactive overview of net generation data for states with RPSs, sorted by non-renewables, all renewables, and only wind and solar. Click on each image to bring up the interactive feature. Sources: Database of State Incentives for Renewables & Efficiency, U.S. Energy Information Administration, and POWER
Non-Renewables
Coal’s share in nearly all states has fallen markedly, most-notably in the New England region. Natural gas’s share has also grown dramatically, especially in states like North Carolina. Nuclear’s share has remained steady, but petroleum’s share has diminished, for example, in New York and California.
All Renewables
When all renewables are considered—including conventional hydropower—wind and solar only make up a small portion of most states’ renewable portfolios. California, New York, and Oregon, notably, have ramped up hydropower production.
Wind and Solar
Still, nearly all states have increased generation from wind power. Especially notable are Texas, Iowa, and Minnesota. Solar generation, meanwhile, has ramped up dramatically in California, North Carolina, and Texas.
The post How Net Generation Has Changed in States with Renewable Portfolio Standards appeared first on POWER Magazine.


