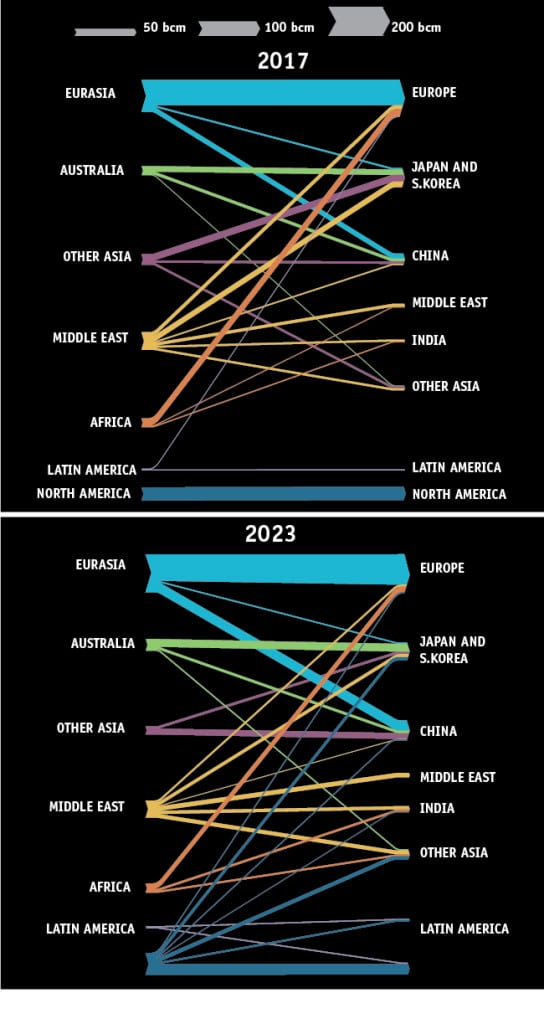
THE BIG PICTURE: A Gas Trade Transformation (Infographic)
According to the International Energy Agency, global natural gas trade has grown by more than 40% over the past 15 years. Over the next five years, current trade flows are expected to significantly diversify, boosted by development of liquefied natural gas (LNG) infrastructure. LNG trade, which grew by 11% in 2017 to 391 billion cubic meters (bcm) is expected to surpass 500 bcm in 2023, driven by strong demand in developing Asian markets (and especially China, which will account for a third of the increase in LNG demand). On the supply side, the Middle East, which has traditionally been the world’s single balancing supplier, will be increasingly challenged by development of export capacity from the U.S., Australia, and Russia.
Source: IEA, Gas Market Report 2018, Figure 3.1, “Main Natural Gas Trade Flows, 2017 and 2023,” OECD/IEA, 2018
Highlights:
The U.S. is set to surpass Australia to become the second-largest LNG exporter by 2023, but it could overtake Qatar if new U.S. export projects achieve their final investment decision (FID) over the next two years. As of June 2018, six U.S. facilities achieved FID, though only two (Sabine Pass and Cove Point) are operational. In May, Cheniere said its Corpus Christi LNG project should begin operations in mid-2022. The U.S. accounts for more than half of liquefaction capacity under development, while Australia’s liquefaction capacity almost tripled between 2013 and 2017.
Bracing for more competition, Qatar—which has enjoyed an undisputed position in global LNG trade since the late 2000s—in 2017 lifted a self-imposed moratorium on exploration and production at its North Field asset, and it has expressed interest in expanding its overseas presence.
Russia is also ramping up liquefaction capacity. In December, the government released Gazprom from price regulation for selling natural gas from LNG export projects. Gazprom is also expanding its overseas partnerships, recently signing memoranda with Iran and Saudi Arabia for natural gas production and liquefaction activities.
China will become the largest natural gas importing country in the world by 2019. Its share of gas imports could rise from 39% to 46% by 2023. Its LNG imports are forecast to increase 80% while pipeline imports from Eurasia will also increase substantially.
Europe also experienced a strong rebound in natural gas imports in 2017, owing to increased demand for power generation. By 2023, the region will increasingly import natural gas through the Southern Gas Corridor, and additional LNG and pipeline gas from traditional suppliers, such as Russia.
Japan, which will remain the world’s largest LNG importer until 2023, is expected to see eroded demand as some nuclear capacity restarts. In October, Japan announced a plan to finance new LNG infrastructure development projects in Asia, with a value of up to $10 billion over the next five years, a move that supports ambitions to open new markets in Asia and find outlets for excess LNG supply.
—Copy and artwork by Sonal Patel, a POWER associate editor
The post THE BIG PICTURE: A Gas Trade Transformation (Infographic) appeared first on POWER Magazine.
